A simulation of the World Cup
In my company we started a betting contest for the incoming World Cup. I often joined this kind of contests, always basing my bets on my gut feeling and always miserably failing. This time I decided to base my bets on something (hopefully) more sensible, and decided to simulate the World Cup from data.
We are using Copabet, which wants you to place all your bets even for who goes through to the play-off stage and all the way to the final before the start of the World Cup.
Where to start: team strength in numbers
While it is rather easy to place a bet on a match in which one of the teams is much stronger than the others (e.g. Brazil - San Marino), it is much harder when you don’t know how to gauge the team’s relative strength. Because of this I decided to use the FIFA National Teams ranking, which is based on a score that measures the strength of each team from the results of their matches (thanks Wikipedia for all the details). There are also other scores and rankings out there which would be interesting to explore, but I decided not to spend a lot of time evaluating and comparing the different options. Going through how the score for the National teams is computed is way beyond the scope of this exercise, but it is worth having a quick look:
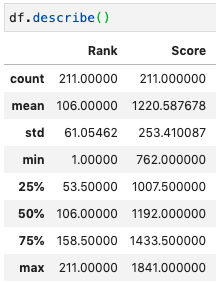
The top team is Brazil with 1841, the worst is San Marino with 762. According to this score, the weakest team who qualified to the World Cup is Ghana, with a score of 1393. From the FIFA scores to relative strengths As mentioned above, I want to base my bets on the relative strength of the teams in each match and in order to do this I started testing a few ways to combine the opponent’s scores into a meaningful metric, and I already found something interesting: for a given match of team1 vs team2 I divided each team’s score ( \(s_i\) ) by the sum of the scores, i.e. \(p_i = s_i / (s_1 + s_2)\). The original idea was to use the \(p_i\)-s computed this way as probabilities of winning for each team in some kind of match simulation (details are given below, but for now you can imagine it as a coin flip with probabilities \(p_1\) and \(p_2\) for the two teams). In order to get a feeling of how this performs I tested this on Brazil - Ghana, i.e. an hypothetical match between the best and the worst teams in the World Cup (according to the FIFA ranking). It turns out Ghana has a 43% chance of winning this match. Seems a bit too much. This might happen for a few reasons, if I had to guess I would say on one hand this reflects that the teams that made it to the World Cup are in general not that bad, they had to qualify for it and, with some outliers (Italy, I am looking at you), the best teams in each continent are there. On the other hand every now and then there are discussions about the FIFA ranking not being very reliable and giving too high a score to some random team. One way or another, all the scores are somewhat squeezed towards high values.
As mentioned in the previous section, it seems reasonable to use the relative strength of the two opponents for a given match, so I decided to start from the difference of the two scores and to normalize it by the average pairwise difference of all the scores. This normalized score difference is then > 1 for a match in which one team is much stronger than the other (i.e. more than the average difference between two teams in the FIFA ranking) and < 1 for a match between two teams that are rather similar.
As a final step, I took the logistic function of the above normalized score basically because I wanted to translate the normalized score into a probability, for reasons that will be clarified in the next section. Here is just a summary of the whole process so far, for a match between team1 and team2 with scores \(s_1\) and \(s_2\), respectively:
\[n_1 = (s_1 - s_2)/\bar{d}\] \[n_2 = (s_2 - s_1)/\bar{d}\textrm{, i.e.\ } n_2 = -n_1\] \[l_1 = \textrm{logistic}(n_1) = 1 / (1 + e^{-n_1})\] \[l_2 = \textrm{logistic}(n_2) = 1 / (1 + e^{-n_2})\textrm{, i.e.\ } l_2 = 1-l_1\]where \(\bar{d}\) is the average of the pairwise score difference.
How to simulate a match
In this wonderful book (and elsewhere too), it is shown how goals each team scores in a match are distributed as a Poisson distribution:
\[P(n) = \frac{\lambda^n e^{-\lambda}}{n!}\]where \(n\) is the number of goals, and \(\lambda\) is the intensity of the process. In this context, \(\lambda\) is the number of goals a team is expected to score in a match, and \(n\) is the actual number of goals it can actually score, each with its own probability. \(\lambda\) is the parameter we need for each team in order to be able to simulate a match: with the \(\lambda\)-s for the two teams, it is possible to simulate the goals scored using poisson processes. Simulating the same match a lot of times it is possible to get the actual probabilities for each team to win the match and for a draw just by counting how many times each team scores more than the other (or when they score the same amount of goals). With such a model that can provide probabilities for each outcome of a match (team1 wins / team2 wins / draw), it is reasonable to bet on the outcome with the highest probability.
I tested two different ways of obtaining it starting from the logistic of normalized score difference from the previous section.
In the last three World Cups, an average of about 2.5 goals per match were scored. So for a given match between team1 and team2 I get lambdas as follows:
\[\lambda_i = l_i * \textrm{average_goals_per_match_in_past_WCs}\]As a second method I looked at the data from the 2018 World Cup and the FIFA scores and ranking as they were in 2018 right before the World Cup. I didn’t include data from more past World Cups because the calculation was updated in 2018, so the risk here is to use and mix data that are not consistent. I used this data to model the average goals scored by a team in a given match as a function of the logistic of normalized score difference. Here is the data: on the horizontal axis there is the logit-normalized-score-difference, on the vertical axis the actual number of goals scored by each team. The green faint “x”-s show the actual goals, the blue dots show the average number of goals taken in bins of the logit-normalized-score-difference.
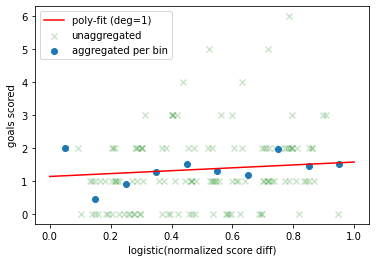
The figure below shows the direct comparison of the two models for \(\lambda\) as a function of the logit-normalized-score-difference.
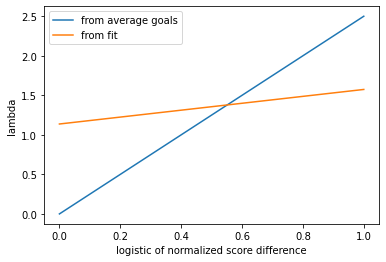
The fitted model has a lower slope, and in some sense it gives much more strength to the weaker teams: in a match between two teams with a huge difference in score, the weaker one will have a logit-normalized-score-difference rather close to 0. The fitted model would assign to this team a lambda close to 1, the model based on the average number of goals per match would assign it a lambda close to 0.
“Calibration” and final tweaks
How to choose between the different parameterizations? For each of them I simulated the whole group stage of the World Cup 2022 and for each match I measured the probabilities for the best team to win, the worst team to win and the probability of a draw. Then I compared these to the fraction of matches that ended with a win of the best team, a win of the worst team and a draw in all the matches of the 2018 World Cup. The comparison is shown below.
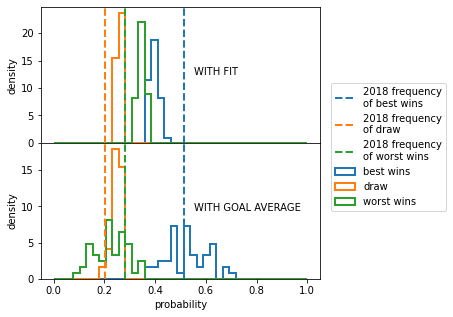
It is quite clear that the parametrization obtained with the fit flattens the differences between the best and the worst team, as already discussed before. Interestingly, the two distributions of the probability of draw look quite similar. I will then drop the fit-based simulation.
For the final simulation I decided to apply a few tweaks.
When running the simulations of the group stages I noticed that, even if the probabilities for each outcome are reasonably in agreement with the past data, the highest probability always goes to the team with the highest score, even when the two teams have very similar scores in the first place. As an example, let’s take a look at the match with the lowest normalized score difference in the group stage: Iran - Wales.
| FIFA score | score difference | normalized score difference | logit-normalized-score-difference | |
|---|---|---|---|---|
| Wales | 1570 | 5 | 0.017 | 0.504 |
| Iran | 1556 | -5 | -0.017 | 0.496 |
| P(Iran wins) | P(draw) | P(Wales wins) |
|---|---|---|
| 35.3% | 26.9% | 37.8% |
Given the above, I introduced a special rule to increase the draws: if P(draw) > 20% and the difference between P(team1 wins) and P(team2 wins) is less than 10% I bet on draw. The statistics in the 2018 World Cup is really too low to try to calibrate this properly, so I’ll just use this as it is.
In the history of the World Cup only once the hosting country did not make it through to the play off stage (South Africa in 2010), therefore I decided to increase the score of Qatar by 10%.
Output
Here is the output of the simulation:
| group | match | P(TEAM1 WINS) | P(DRAW) | P(TEAM2 WINS) | my pick |
|---|---|---|---|---|---|
| A | Senegal-Netherlands | 25.7% | 25.7% | 48.6% | Netherlands |
| A | Ecuador-Netherlands | 16.2% | 23.7% | 60.1% | Netherlands |
| A | Qatar-Netherlands | 15.5% | 21.3% | 63.1% | Netherlands |
| A | Ecuador-Senegal | 25.1% | 26.2% | 48.7% | Senegal |
| A | Qatar-Senegal | 23.5% | 25.4% | 51.2% | Draw |
| A | Qatar-Ecuador | 33.7% | 27.0% | 39.4% | Qatar |
| B | United States-England | 26.0% | 26.1% | 47.9% | England |
| B | Wales-England | 21.7% | 25.3% | 53.0% | England |
| B | Iran-England | 22.4% | 25.6% | 52.0% | England |
| B | Wales-United States | 31.9% | 26.8% | 41.4% | United States |
| B | Iran-United States | 29.0% | 27.2% | 43.8% | United States |
| B | Iran-Wales | 35.7% | 27.9% | 36.4% | Draw |
| C | Mexico-Argentina | 23.6% | 25.7% | 50.7% | Argentina |
| C | Poland-Argentina | 17.2% | 23.8% | 59.0% | Argentina |
| C | Saudi Arabia-Argentina | 10.8% | 19.9% | 69.3% | Argentina |
| C | Poland-Mexico | 27.5% | 25.2% | 47.3% | Mexico |
| C | Saudi Arabia-Mexico | 18.8% | 23.1% | 58.1% | Mexico |
| C | Saudi Arabia-Poland | 24.9% | 25.6% | 49.5% | Poland |
| D | Denmark-France | 28.6% | 26.5% | 44.9% | France |
| D | Tunisia-France | 15.1% | 23.1% | 61.8% | France |
| D | Australia-France | 14.2% | 23.6% | 62.2% | France |
| D | Tunisia-Denmark | 21.7% | 25.2% | 53.2% | Denmark |
| D | Australia-Denmark | 21.5% | 24.7% | 53.8% | Denmark |
| D | Australia-Tunisia | 33.8% | 27.3% | 39.0% | Draw |
| E | Germany-Spain | 30.7% | 26.5% | 42.8% | Spain |
| E | Japan-Spain | 20.4% | 25.8% | 53.9% | Spain |
| E | Costa Rica-Spain | 17.7% | 24.4% | 58.0% | Spain |
| E | Japan-Germany | 27.2% | 26.3% | 46.6% | Germany |
| E | Costa Rica-Germany | 22.0% | 25.8% | 52.2% | Germany |
| E | Costa Rica-Japan | 30.5% | 26.6% | 42.9% | Japan |
| F | Croatia-Belgium | 20.7% | 24.7% | 54.6% | Belgium |
| F | Morocco-Belgium | 15.7% | 23.6% | 60.7% | Belgium |
| F | Canada-Belgium | 11.1% | 20.4% | 68.5% | Belgium |
| F | Morocco-Croatia | 27.7% | 26.7% | 45.5% | Croatia |
| F | Canada-Croatia | 20.7% | 25.6% | 53.7% | Croatia |
| F | Canada-Morocco | 29.0% | 25.5% | 45.5% | Morocco |
| G | Switzerland-Brazil | 17.9% | 23.2% | 58.9% | Brazil |
| G | Serbia-Brazil | 13.7% | 21.2% | 65.1% | Brazil |
| G | Cameroon-Brazil | 9.9% | 19.6% | 70.5% | Brazil |
| G | Serbia-Switzerland | 30.2% | 27.0% | 42.7% | Switzerland |
| G | Cameroon-Switzerland | 21.6% | 25.1% | 53.2% | Switzerland |
| G | Cameroon-Serbia | 26.9% | 27.1% | 46.0% | Serbia |
| H | Uruguay-Portugal | 32.7% | 27.4% | 39.9% | Draw |
| H | Korea Republic-Portugal | 22.9% | 25.7% | 51.4% | Portugal |
| H | Ghana-Portugal | 13.7% | 20.7% | 65.6% | Portugal |
| H | Korea Republic-Uruguay | 26.6% | 26.3% | 47.1% | Uruguay |
| H | Ghana-Uruguay | 15.1% | 23.0% | 61.8% | Uruguay |
| H | Ghana-Korea Republic | 24.2% | 26.8% | 49.0% | Korea Republic |
It has to be kept in mind that all of the above is based on the FIFA score before the World Cup and that it can’t take into account everything that will happen from now on: last-minute injuries, the overall condition of a team, etc. The most important factor not taken into account here is how the results of the first few matches influences the rest of the competition.
As mentioned above the best team in each match has the highest probability to win. While it is reasonable to place my bet following this rule, I am honestly a bit let down: after all this work I was expecting to get something better than just picking the team with the highest score in each match.
It is reasonable to place the bet on the team with the highest probability to win since this is what I am supposed to bet on, while for a different kind of bet other choices would have been more meaningful (e.g. one could bet on the exact result of a match, and therefore pick the most likely final result of the match from the simulated goals).
One interesting by-product of the above simulation is that there is a quite nice prediction of how each group will end: it is enough to multiply the points each team would get for each outcome of each match by the probabilities obtained above.
GROUP A
| Team | expected points |
|---|---|
| Netherlands | 5.46 |
| Senegal | 4.15 |
| Qatar | 4.14 |
| Ecuador | 2.71 |
GROUP B
| Team | expected points |
|---|---|
| England | 5.34 |
| United States | 4.16 |
| Iran | 3.49 |
| Wales | 3.43 |
GROUP C
| Team | expected points |
|---|---|
| Argentina | 6.12 |
| Mexico | 4.63 |
| Poland | 3.47 |
| Saudi Arabia | 2.33 |
GROUP D
| Team | expected points |
|---|---|
| France | 5.92 |
| Denmark | 4.77 |
| Tunisia | 3.01 |
| Australia | 2.82 |
GROUP E
| Team | expected points |
|---|---|
| Spain | 5.43 |
| Germany | 4.63 |
| Japan | 3.59 |
| Costa Rica | 2.79 |
GROUP F
| Team | expected points |
|---|---|
| Belgium | 6.28 |
| Croatia | 4.32 |
| Morocco | 3.42 |
| Canada | 2.52 |
GROUP G
| Team | expected points |
|---|---|
| Brazil | 6.41 |
| Switzerland | 4.22 |
| Serbia | 3.46 |
| Cameroon | 2.47 |
GROUP H
| Team | expected points |
|---|---|
| Portugal | 5.46 |
| Uruguay | 5.03 |
| Korea Republic | 3.78 |
| Ghana | 2.23 |
It will be very interesting to compare this to the actual final ranking in each group once all the matches will be over.
Based on the above rankings in each group we can expect some quite tight races to happen here and there: Senegal-Qatar for the second place in group A, United States-Iran for the second place in group B, Spain-Germany for the first place in group E, Croatia-Morocco for the second place in group F, Switzerland-Serbia in group G and Portugal-Uruguay in group H.
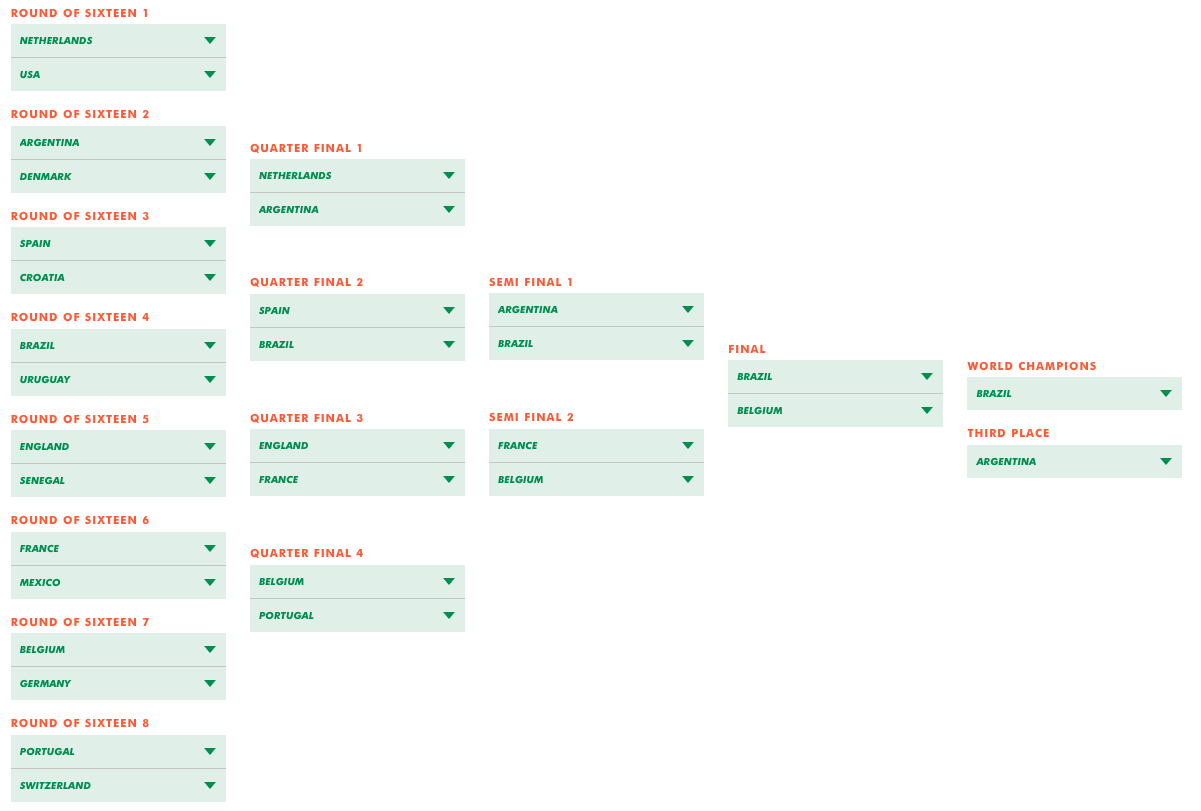
I bet on the first and second team in the above rankings to go through to the play-off stage and use the same method to simulate the matches at each stage. Given that in the end I am betting on the best team in each match, I think you can guess what my predicted winner is … Brazil! (Honestly, I would have bet on Brazil even based on gut feeling ![]() ).
).
Here is the full play-off stage from my simulation:
Conclusions
It has been a nice exercise that I set up in a few days. As mentioned above I am a bit disappointed that in the end I am simply betting on the team with the highest ranking in each match, while I was expecting to get something more advanced. On the other hand if you want to play it safe it is reasonable to always place your bets on the best team.
After the World Cup I will compare my predictions to the actual results and see how bad this simulation is ![]()
All the code I developed and used for this simulation is here.